TensorFlow:使用TensorFlow實現反向傳播演演算法
反向傳播演演算法
1.啟用函數導數
1.1 Sigmoid函數導數
Sigmoid函數表示式:
σ
(
x
)
=
1
1
+
e
−
x
\sigma(x) = \frac{1}{1 + e^{-x}}
σ(x)=1+e−x1
Sigmoid函數的導數表示式:
d
d
x
σ
(
x
)
=
σ
(
1
−
σ
)
\frac{d}{dx} \sigma(x) = \sigma(1-\sigma)
dxdσ(x)=σ(1−σ)
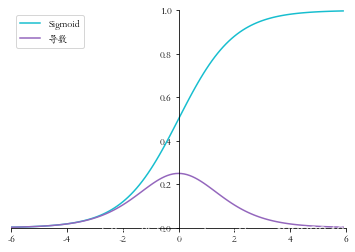
下面我們用程式碼來實現Sigmoid函數及其導數,並進行視覺化
# 匯入 numpy 庫
import numpy as np
from matplotlib import pyplot as plt
plt.rcParams['font.size'] = 16
plt.rcParams['font.family'] = ['STKaiti']
plt.rcParams['axes.unicode_minus'] = False

def set_plt_ax():
    # get current axis 獲得座標軸物件
    ax = plt.gca()

    ax.spines['right'].set_color('none')
    # 將右邊 上邊的兩條邊顏色設定為空 其實就相當於抹掉這兩條邊
    ax.spines['top'].set_color('none')

    ax.xaxis.set_ticks_position('bottom')
    # 指定下邊的邊作為 x 軸,指定左邊的邊為 y 軸
    ax.yaxis.set_ticks_position('left')

    # 指定 data  設定的bottom(也就是指定的x軸)繫結到y軸的0這個點上
    ax.spines['bottom'].set_position(('data', 0))
    ax.spines['left'].set_position(('data', 0))

def sigmoid(x):
    # 實現 sigmoid 函數
    return 1 / (1 + np.exp(-x))

def sigmoid_derivative(x):
    # sigmoid 導數的計算
    # sigmoid 函數的表示式由手動推導而得
    return sigmoid(x)*(1-sigmoid(x))
畫圖
x = np.arange(-6.0, 6.0, 0.1)
sigmoid_y = sigmoid(x)
sigmoid_derivative_y = sigmoid_derivative(x)

set_plt_ax()
plt.plot(x, sigmoid_y, color='C9', label='Sigmoid')
plt.plot(x, sigmoid_derivative_y, color='C4', label='導數')
plt.xlim(-6, 6)
plt.ylim(0, 1)
plt.legend(loc=2)
plt.show()
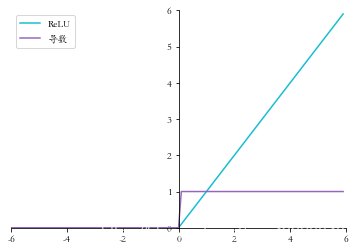
1.2 ReLU 函數導數
ReLU 函數的表示式:
ReLU
(
x
)
=
max
(
0
,
x
)
\text{ReLU}(x)=\max(0,x)
ReLU(x)=max(0,x)
ReLU 函數的導數表示式:
d
d
x
ReLU
=
{
1
x
⩾
0
0
x
<
0
\frac{d}{dx} \text{ReLU} = \left \{ \begin{array}{cc} 1 \quad x \geqslant 0 \\ 0 \quad x < 0 \end{array} \right.
dxdReLU={1x⩾00x<0
下面我們用程式碼來實現relu函數及其導數,並進行視覺化
def relu(x):
    return np.maximum(0, x)

def relu_derivative(x): # ReLU 函數的導數
    d = np.array(x, copy=True) # 用於儲存梯度的張量
    d[x < 0] = 0 # 元素為負的導數為 0
    d[x >= 0] = 1 # 元素為正的導數為 1
    return d
x = np.arange(-6.0, 6.0, 0.1)
relu_y = relu(x)
relu_derivative_y = relu_derivative(x)

set_plt_ax()
plt.plot(x, relu_y, color='C9', label='ReLU')
plt.plot(x, relu_derivative_y, color='C4', label='導數')
plt.xlim(-6, 6)
plt.ylim(0, 6)
plt.legend(loc=2)
plt.show()
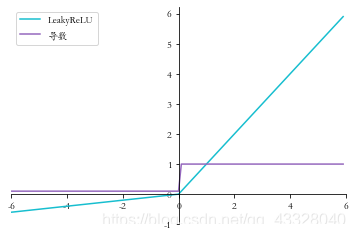
1.3 LeakyReLU函數導數
LeakyReLU 函數的表示式: LeakyReLU = { x x ⩾ 0 p x x < 0 \text{LeakyReLU} = \left\{ \begin{array}{cc} x \quad x \geqslant 0 \\ px \quad x < 0 \end{array} \right. LeakyReLU={xx⩾0pxx<0
LeakyReLU的函數導數表示式: d d x LeakyReLU = { 1 x ⩾ 0 p x < 0 \frac{d}{dx} \text{LeakyReLU} = \left\{ \begin{array}{cc} 1 \quad x \geqslant 0 \\ p \quad x < 0 \end{array} \right. dxdLeakyReLU={1x⩾0px<0
def leakyrelu(x, p):
    y = np.copy(x)
    y[y < 0] = p * y[y < 0]
    return y

# 其中 p 為 LeakyReLU 的負半段斜率,為超引數
def leakyrelu_derivative(x, p):
    dx = np.ones_like(x) # 建立梯度張量,全部初始化為 1
    dx[x < 0] = p # 元素為負的導數為 p
    return dx
x = np.arange(-6.0, 6.0, 0.1)
p = 0.1
leakyrelu_y = leakyrelu(x, p)
leakyrelu_derivative_y = leakyrelu_derivative(x, p)

set_plt_ax()
plt.plot(x, leakyrelu_y, color='C9', label='LeakyReLU')
plt.plot(x, leakyrelu_derivative_y, color='C4', label='導數')
plt.xlim(-6, 6)
plt.yticks(np.arange(-1, 7))
plt.legend(loc=2)
plt.show()
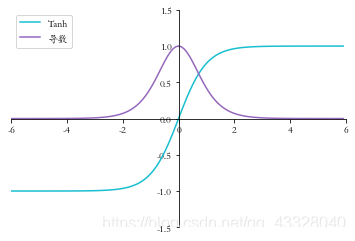
1.4 Tanh 函數梯度
tanh函數的表示式:
tanh
(
x
)
=
e
x
−
e
−
x
e
x
+
e
−
x
=
2
⋅
sigmoid
(
2
x
)
−
1
\tanh(x)=\frac{e^x-e^{-x}}{e^x + e^{-x}}= 2 \cdot \text{sigmoid}(2x) - 1
tanh(x)=ex+e−xex−e−x=2⋅sigmoid(2x)−1
tanh函數的導數表示式:
d
d
x
tanh
(
x
)
=
(
e
x
+
e
−
x
)
(
e
x
+
e
−
x
)
−
(
e
x
−
e
−
x
)
(
e
x
−
e
−
x
)
(
e
x
+
e
−
x
)
2
=
1
−
(
e
x
−
e
−
x
)
2
(
e
x
+
e
−
x
)
2
=
1
−
tanh
2
(
x
)
\begin{aligned} \frac{\mathrm{d}}{\mathrm{d} x} \tanh (x) &=\frac{\left(e^{x}+e^{-x}\right)\left(e^{x}+e^{-x}\right)-\left(e^{x}-e^{-x}\right)\left(e^{x}-e^{-x}\right)}{\left(e^{x}+e^{-x}\right)^{2}} \\ &=1-\frac{\left(e^{x}-e^{-x}\right)^{2}}{\left(e^{x}+e^{-x}\right)^{2}}=1-\tanh ^{2}(x) \end{aligned}
dxdtanh(x)=(ex+e−x)2(ex+e−x)(ex+e−x)−(ex−e−x)(ex−e−x)=1−(ex+e−x)2(ex−e−x)2=1−tanh2(x)
def sigmoid(x): # sigmoid 函數實現
    return 1 / (1 + np.exp(-x))
def tanh(x): # tanh 函數實現
    return 2*sigmoid(2*x) - 1
def tanh_derivative(x): # tanh 導數實現
    return 1-tanh(x)**2
x = np.arange(-6.0, 6.0, 0.1)
tanh_y = tanh(x)
tanh_derivative_y = tanh_derivative(x)

set_plt_ax()
plt.plot(x, tanh_y, color='C9', label='Tanh')
plt.plot(x, tanh_derivative_y, color='C4', label='導數')
plt.xlim(-6, 6)
plt.ylim(-1.5, 1.5)
plt.legend(loc=2)
plt.show()
2.鏈式法則
import tensorflow as tf
# 構建待優化變數
x = tf.constant(1.)
w1 = tf.constant(2.)
b1 = tf.constant(1.)
w2 = tf.constant(2.)
b2 = tf.constant(1.)

# 構建梯度記錄器
with tf.GradientTape(persistent=True) as tape:
    # 非 tf.Variable 型別的張量需要人為設定記錄梯度資訊
    tape.watch([w1, b1, w2, b2])
    # 構建 2 層線性網路
    y1 = x * w1 + b1
    y2 = y1 * w2 + b2

# 獨立求解出各個偏導數
dy2_dy1 = tape.gradient(y2, [y1])[0]
dy1_dw1 = tape.gradient(y1, [w1])[0]
dy2_dw1 = tape.gradient(y2, [w1])[0]
# 驗證鏈式法則, 2 個輸出應相等
print(dy2_dy1 * dy1_dw1)
print(dy2_dw1)
tf.Tensor(2.0, shape=(), dtype=float32)
tf.Tensor(2.0, shape=(), dtype=float32)
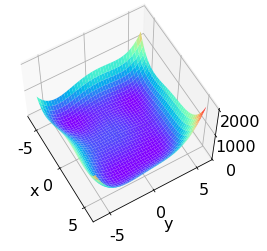
Himmelblau 函數是用來測試優化演演算法的常用樣例函數之一,它包含了兩個自變數 x x x和 y y y,數學表示式是: f ( x , y ) = ( x 2 + y − 11 ) 2 + ( x + y 2 − 7 ) 2 f(x, y)=\left(x^{2}+y-11\right)^{2}+\left(x+y^{2}-7\right)^{2} f(x,y)=(x2+y−11)2+(x+y2−7)2
from mpl_toolkits.mplot3d import Axes3D

def himmelblau(x):
    # himmelblau 函數實現,傳入引數 x 為 2 個元素的 List
    return (x[0] ** 2 + x[1] - 11) ** 2 + (x[0] + x[1] ** 2 - 7) ** 2
x = np.arange(-6, 6, 0.1) # 視覺化的 x 座標範圍為-6~6
y = np.arange(-6, 6, 0.1) # 視覺化的 y 座標範圍為-6~6
print('x,y range:', x.shape, y.shape)
# 生成 x-y 平面取樣網格點,方便視覺化
X, Y = np.meshgrid(x, y)
print('X,Y maps:', X.shape, Y.shape)
Z = himmelblau([X, Y]) # 計算網格點上的函數值
x,y range: (120,) (120,)
X,Y maps: (120, 120) (120, 120)
# 繪製 himmelblau 函數曲面
fig = plt.figure('himmelblau')
ax = fig.gca(projection='3d') # 設定 3D 座標軸
ax.plot_surface(X, Y, Z, cmap = plt.cm.rainbow ) # 3D 曲面圖
ax.view_init(60, -30)
ax.set_xlabel('x')
ax.set_ylabel('y')
plt.show()
# 引數的初始化值對優化的影響不容忽視,可以通過嘗試不同的初始化值,
# 檢驗函數優化的極小值情況
# [1., 0.], [-4, 0.], [4, 0.]
# 初始化引數
x = tf.constant([4., 0.])

for step in range(200):# 迴圈優化 200 次
    with tf.GradientTape() as tape: #梯度跟蹤
        tape.watch([x]) # 加入梯度跟蹤列表
        y = himmelblau(x) # 前向傳播

    # 反向傳播
    grads = tape.gradient(y, [x])[0]
    # 更新引數,0.01 為學習率
    x -= 0.01*grads
    # 列印優化的極小值
    if step % 20 == 19:
        print ('step {}: x = {}, f(x) = {}'.format(step, x.numpy(), y.numpy()))
step 19: x = [ 3.5381215 -1.3465767], f(x) = 3.7151756286621094
step 39: x = [ 3.5843277 -1.8470242], f(x) = 3.451140582910739e-05
step 59: x = [ 3.584428  -1.8481253], f(x) = 4.547473508864641e-11
step 79: x = [ 3.584428  -1.8481264], f(x) = 1.1368684856363775e-12
step 99: x = [ 3.584428  -1.8481264], f(x) = 1.1368684856363775e-12
step 119: x = [ 3.584428  -1.8481264], f(x) = 1.1368684856363775e-12
step 139: x = [ 3.584428  -1.8481264], f(x) = 1.1368684856363775e-12
step 159: x = [ 3.584428  -1.8481264], f(x) = 1.1368684856363775e-12
step 179: x = [ 3.584428  -1.8481264], f(x) = 1.1368684856363775e-12
step 199: x = [ 3.584428  -1.8481264], f(x) = 1.1368684856363775e-12
3.反向傳播演演算法實戰
匯入庫
import matplotlib.pyplot as plt
import numpy as np
import seaborn as sns
from sklearn.datasets import make_moons
from sklearn.model_selection import train_test_split

plt.rcParams['font.size'] = 16
plt.rcParams['font.family'] = ['STKaiti']
plt.rcParams['axes.unicode_minus'] = False
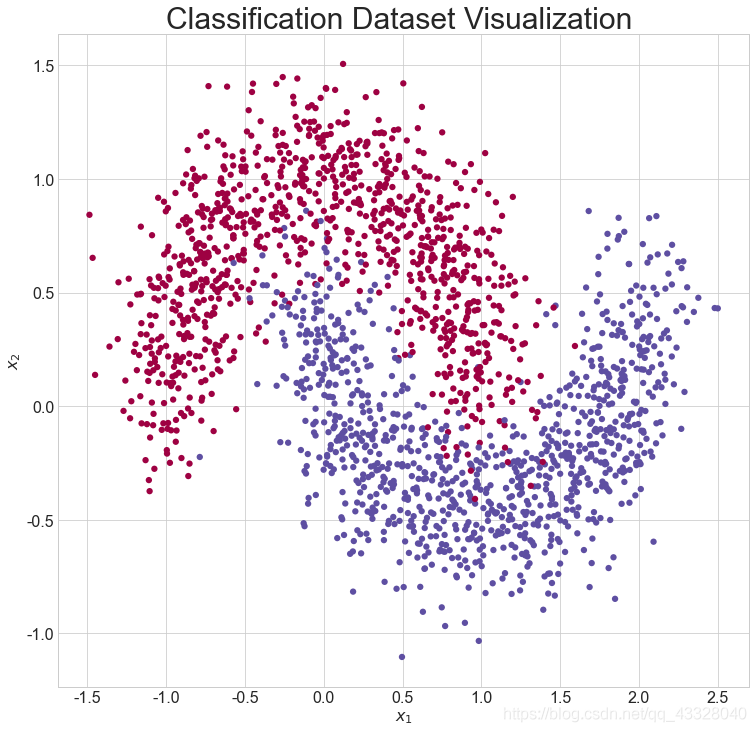
建立資料
def load_dataset():
    # 取樣點數
    N_SAMPLES = 2000
    # 測試數量比率
    TEST_SIZE = 0.3
    # 利用工具函數直接生成資料集
    X, y = make_moons(n_samples=N_SAMPLES, noise=0.2, random_state=100)
    # 將 2000 個點按著 7:3 分割為訓練集和測試集
    X_train, X_test, y_train, y_test = train_test_split(X, y, test_size=TEST_SIZE, random_state=42)
    return X, y, X_train, X_test, y_train, y_test
畫圖
def make_plot(X, y, plot_name, XX=None, YY=None, preds=None, dark=False):
    # 繪製資料集的分佈, X 為 2D 座標, y 為資料點的標籤
    if (dark):
        plt.style.use('dark_background')
    else:
        sns.set_style("whitegrid")
    plt.figure(figsize=(16, 12))
    axes = plt.gca()
    axes.set(xlabel="$x_1$", ylabel="$x_2$")
    plt.title(plot_name, fontsize=30)
    plt.subplots_adjust(left=0.20)
    plt.subplots_adjust(right=0.80)
    if XX is not None and YY is not None and preds is not None:
        plt.contourf(XX, YY, preds.reshape(XX.shape), 25, alpha=1, cmap=plt.cm.Spectral)
        plt.contour(XX, YY, preds.reshape(XX.shape), levels=[.5], cmap="Greys", vmin=0, vmax=.6)
    # 繪製散點圖,根據標籤區分顏色
    plt.scatter(X[:, 0], X[:, 1], c=y.ravel(), s=40, cmap=plt.cm.Spectral, edgecolors='none')
    plt.show()
X, y, X_train, X_test, y_train, y_test = load_dataset()
# 呼叫 make_plot 函數繪製資料的分佈,其中 X 為 2D 座標, y 為標籤
make_plot(X, y, "Classification Dataset Visualization ")
網路層
通過新建類 Layer 實現一個網路層,需要傳入網路層的資料節點數,輸出節點數,激
活函數型別等引數,權值 weights 和偏置張量 bias 在初始化時根據輸入、輸出節點數自動
生成並初始化:
class Layer:
    # 全連線網路層
    def __init__(self, n_input, n_neurons, activation=None, weights=None,
                 bias=None):
        """
        :param int n_input: 輸入節點數
        :param int n_neurons: 輸出節點數
        :param str activation: 啟用函數型別
        :param weights: 權值張量,預設類內部生成
        :param bias: 偏置,預設類內部生成
        """
        # 通過正態分佈初始化網路權值,初始化非常重要,不合適的初始化將導致網路不收斂
        self.weights = weights if weights is not None else np.random.randn(n_input, n_neurons) * np.sqrt(1 / n_neurons)
        self.bias = bias if bias is not None else np.random.rand(n_neurons) * 0.1
        self.activation = activation  # 啟用函數型別,如’sigmoid’
        self.last_activation = None  # 啟用函數的輸出值o
        self.error = None  # 用於計算當前層的delta 變數的中間變數
        self.delta = None  # 記錄當前層的delta 變數,用於計算梯度

    # 網路層的前向傳播函數實現如下,其中last_activation 變數用於儲存當前層的輸出值:
    def activate(self, x):
        # 前向傳播函數
        r = np.dot(x, self.weights) + self.bias  # X@W+b
        # 通過啟用函數,得到全連線層的輸出o
        self.last_activation = self._apply_activation(r)
        return self.last_activation

    # 上述程式碼中的self._apply_activation 函數實現了不同型別的啟用函數的前向計算過程,
    # 儘管此處我們只使用Sigmoid 啟用函數一種。程式碼如下:
    def _apply_activation(self, r):
        # 計算啟用函數的輸出
        if self.activation is None:
            return r  # 無啟用函數,直接返回
        # ReLU 啟用函數
        elif self.activation == 'relu':
            return np.maximum(r, 0)
        # tanh 啟用函數
        elif self.activation == 'tanh':
            return np.tanh(r)
        # sigmoid 啟用函數
        elif self.activation == 'sigmoid':
            return 1 / (1 + np.exp(-r))
        return r

    # 針對於不同型別的啟用函數,它們的導數計算實現如下:
    def apply_activation_derivative(self, r):
        # 計算啟用函數的導數
        # 無啟用函數,導數為1
        if self.activation is None:
            return np.ones_like(r)
        # ReLU 函數的導數實現
        elif self.activation == 'relu':
            grad = np.array(r, copy=True)
            grad[r > 0] = 1.
            grad[r <= 0] = 0.
            return grad
        # tanh 函數的導數實現
        elif self.activation == 'tanh':
            return 1 - r ** 2
        # Sigmoid 函數的導數實現
        elif self.activation == 'sigmoid':
            return r * (1 - r)
        return r
網路模型
實現單層網路類後,我們實現網路模型的類 NeuralNetwork,它內部維護各層的網路層
Layer 類物件,可以通過 add_layer 函數追加網路層,實現如下:
# 神經網路模型
class NeuralNetwork:
    def __init__(self):
        self._layers = []  # 網路層物件列表

    def add_layer(self, layer):
        # 追加網路層
        self._layers.append(layer)

    # 網路的前向傳播只需要迴圈調各個網路層物件的前向計算函數即可,程式碼如下:
    # 前向傳播
    def feed_forward(self, X):
        for layer in self._layers:
            # 依次通過各個網路層
            X = layer.activate(X)
        return X

    def backpropagation(self, X, y, learning_rate):
        # 反向傳播演演算法實現
        # 前向計算,得到輸出值
        output = self.feed_forward(X)
        for i in reversed(range(len(self._layers))):  # 反向迴圈
            layer = self._layers[i]  # 得到當前層物件
            # 如果是輸出層
            if layer == self._layers[-1]:  # 對於輸出層
                layer.error = y - output  # 計算2 分類任務的均方差的導數
                # 關鍵步驟:計算最後一層的delta,參考輸出層的梯度公式
                layer.delta = layer.error * layer.apply_activation_derivative(output)
            else:  # 如果是隱藏層
                next_layer = self._layers[i + 1]  # 得到下一層物件
                layer.error = np.dot(next_layer.weights, next_layer.delta)
                # 關鍵步驟:計算隱藏層的delta,參考隱藏層的梯度公式
                layer.delta = layer.error * layer.apply_activation_derivative(layer.last_activation)

        # 迴圈更新權值
        for i in range(len(self._layers)):
            layer = self._layers[i]
            # o_i 為上一網路層的輸出
            o_i = np.atleast_2d(X if i == 0 else self._layers[i - 1].last_activation)
            # 梯度下降演演算法,delta 是公式中的負數,故這裡用加號
            layer.weights += layer.delta * o_i.T * learning_rate

    def train(self, X_train, X_test, y_train, y_test, learning_rate, max_epochs):
        # 網路訓練函數
        # one-hot 編碼
        y_onehot = np.zeros((y_train.shape[0], 2))
        y_onehot[np.arange(y_train.shape[0]), y_train] = 1

        # 將One-hot 編碼後的真實標籤與網路的輸出計算均方誤差,並呼叫反向傳播函數更新網路引數,迴圈迭代訓練集1000 遍即可
        mses = []
        accuracys = []
        for i in range(max_epochs + 1):  # 訓練1000 個epoch
            for j in range(len(X_train)):  # 一次訓練一個樣本
                self.backpropagation(X_train[j], y_onehot[j], learning_rate)
            if i % 10 == 0:
                # 列印出MSE Loss
                mse = np.mean(np.square(y_onehot - self.feed_forward(X_train)))
                mses.append(mse)
                accuracy = self.accuracy(self.predict(X_test), y_test.flatten())
                accuracys.append(accuracy)
                print('Epoch: #%s, MSE: %f' % (i, float(mse)))
                # 統計並列印準確率
                print('Accuracy: %.2f%%' % (accuracy * 100))
        return mses, accuracys

    def predict(self, X):
        return self.feed_forward(X)

    def accuracy(self, X, y):
        return np.sum(np.equal(np.argmax(X, axis=1), y)) / y.shape[0]
範例化網路類
nn = NeuralNetwork()  # 範例化網路類
nn.add_layer(Layer(2, 25, 'sigmoid'))  # 隱藏層 1, 2=>25
nn.add_layer(Layer(25, 50, 'sigmoid'))  # 隱藏層 2, 25=>50
nn.add_layer(Layer(50, 25, 'sigmoid'))  # 隱藏層 3, 50=>25
nn.add_layer(Layer(25, 2, 'sigmoid'))  # 輸出層, 25=>2
mses, accuracys = nn.train(X_train, X_test, y_train, y_test, 0.01, 1000)
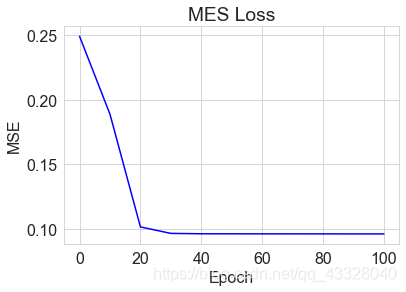
我們將每個 epoch 的損失ℒ記錄下,並繪製為曲線:
x = [i for i in range(0, 101, 10)]
# 繪製MES曲線
plt.title("MES Loss")
plt.plot(x, mses[:11], color='blue')
plt.xlabel('Epoch')
plt.ylabel('MSE')
plt.show()
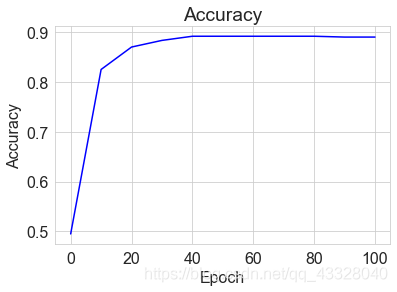
# 繪製Accuracy曲線
plt.title("Accuracy")
plt.plot(x, accuracys[:11], color='blue')
plt.xlabel('Epoch')
plt.ylabel('Accuracy')
plt.show()