使用樣式表和rcParams自定義Matplotlib
style包新增了對易於切換繪製「樣式」的支援,其具有與matplotlib rc檔案相同的引數(在啟動時讀取以組態matplotlib)。
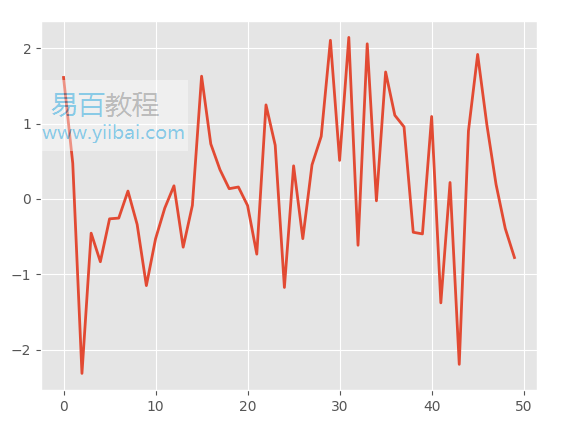
Matplotlib提供了許多預定義的樣式。例如,有一個名為「ggplot」的預定義樣式,它模仿ggplot(R的流行繪圖包)的美學。要使用此樣式,只需新增:
import numpy as np
import matplotlib.pyplot as plt
import matplotlib as mpl
plt.style.use('ggplot')
data = np.random.randn(50)
要列出所有可用的樣式,請使用:
print(plt.style.available)
結果如下所示 -
['seaborn-ticks', 'ggplot', 'dark_background', 'bmh', 'seaborn-poster', 'seaborn-notebook', 'fast', 'seaborn', 'classic', 'Solarize_Light2', 'seaborn-dark', 'seaborn-pastel', 'seaborn-muted', '_classic_test', 'seaborn-paper', 'seaborn-colorblind', 'seaborn-bright', 'seaborn-talk', 'seaborn-dark-palette', 'tableau-colorblind10', 'seaborn-darkgrid', 'seaborn-whitegrid', 'fivethirtyeight', 'grayscale', 'seaborn-white', 'seaborn-deep']
定義自己樣式
可以通過呼叫style.use以及樣式表的路徑或URL來建立自定義樣式並使用它們。此外,如果將<style-name>.mplstyle檔案新增到mpl_configdir/stylelib,則可以通過呼叫style.use(<style-name>)重用自定義樣式表。預設情況下,mpl_configdir應為~/.config/matplotlib,但可以使用matplotlib.get_configdir()來檢查位置。可能需要建立此目錄。還可以通過設定MPLCONFIGDIR環境變數來更改matplotlib查詢stylelib/檔案夾的目錄。
注意,如果樣式具有相同的名稱,則
mpl_configdir/stylelib中的自定義樣式表將覆蓋matplotlib定義的樣式表。
例如,可能希望使用以下命令建立mpl_configdir/stylelib/presentation.mplstyle:
axes.titlesize : 24
axes.labelsize : 20
lines.linewidth : 3
lines.markersize : 10
xtick.labelsize : 16
ytick.labelsize : 16
然後,當想要將針對紙張設計的繪圖調整為在簡報中看起來很好的繪圖時,可以新增:
>>> import matplotlib.pyplot as plt
>>> plt.style.use('presentation')
構圖樣式
樣式表旨在組合在一起。可以擁有一個自定義顏色的樣式表和一個可以改變簡報元素大小的單獨樣式表。通過傳遞樣式列表可以輕鬆組合這些樣式:
>>> import matplotlib.pyplot as plt
>>> plt.style.use(['dark_background', 'presentation'])
請注意,右側的樣式將覆蓋左側樣式已定義的值。
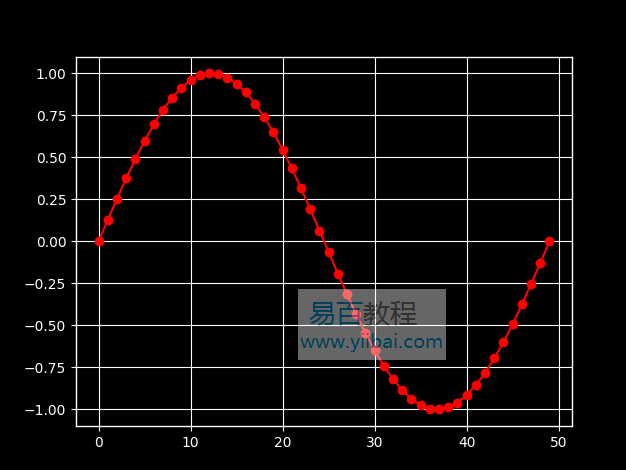
臨時樣式
如果只想為特定程式碼塊使用樣式但不想更改全域性樣式,則樣式包提供上下文管理器,用於將更改限制為特定範圍。要隔離樣式更改,可以編寫如下內容:
with plt.style.context('dark_background'):
    plt.plot(np.sin(np.linspace(0, 2 * np.pi)), 'r-o')
plt.show()
matplotlib rcParams
動態rc設定
還可以在python指令碼中動態更改預設的rc設定,或者從python shell以互動方式更改。所有rc設定都儲存在一個名為matplotlib.rcParams的類字典變數中,變數對於matplotlib包是全域性的。rcParams可以直接修改,例如:
mpl.rcParams['lines.linewidth'] = 2
mpl.rcParams['lines.color'] = 'r'
plt.plot(data)
Matplotlib還提供了一些用於修改rc設定的便捷功能。matplotlib.rc()命令可用於使用關鍵字引數一次修改單個組中的多個設定:
mpl.rc('lines', linewidth=4, color='g')
plt.plot(data)

matplotlib.rcdefaults()命令將恢復標準的matplotlib預設設定。
設定rcParams的值時有一定程度的驗證。
matplotlibrc檔案
matplotlib使用matplotlibrc組態檔案來自定義各種屬性,我們稱之為rc設定或rc引數。可以控制matplotlib中幾乎每個屬性的預設值:圖形大小和dpi,線寬,顏色和style, axes, axis和grid屬性,文字和字型屬性等。matplotlib按以下順序在四個位置查詢matplotlibrc:
- 當前工作目錄中的
matplotlibrc,通常用於不希望在其他位置應用的特定自定義。 $MATPLOTLIBRC如果是檔案,則為$MATPLOTLIBRC/matplotlibrc。- 它接下來是在特定於使用者的位置,具體取決於您的平台:
- 在Linux和FreeBSD上,如果已經自定義環境,它會檢視
.config/matplotlib/matplotlibrc(或$XDG_CONFIG_HOME/matplotlib/matplotlibrc)。 - 在其他平台上,它查詢
.matplotlib/matplotlibrc。
- 在Linux和FreeBSD上,如果已經自定義環境,它會檢視
INSTALL/matplotlib/mpl-data/matplotlibrc,其中INSTALL類似於Linux上的/usr/lib/python3.7/site-packages,可能是Windows上的C:\Python37\Lib\site-packages。每次安裝matplotlib時,都會覆蓋此檔案,因此如果要儲存自定義項,請將此檔案移動到特定於使用者的matplotlib目錄。
找到matplotlibrc檔案後,它將不會搜尋任何其他路徑。
要顯示當前活動的matplotlibrc檔案的載入位置,可以執行以下操作:
>>> import matplotlib
>>> matplotlib.matplotlib_fname()
'/home/foo/.config/matplotlib/matplotlibrc'
一個範例matplotlibrc檔案
#### MATPLOTLIBRC FORMAT
## This is a sample matplotlib configuration file - you can find a copy
## of it on your system in
## site-packages/matplotlib/mpl-data/matplotlibrc. If you edit it
## there, please note that it will be overwritten in your next install.
## If you want to keep a permanent local copy that will not be
## overwritten, place it in the following location:
## unix/linux:
## $HOME/.config/matplotlib/matplotlibrc or
## $XDG_CONFIG_HOME/matplotlib/matplotlibrc (if $XDG_CONFIG_HOME is set)
## other platforms:
## $HOME/.matplotlib/matplotlibrc
##
## See http://matplotlib.org/users/customizing.html#the-matplotlibrc-file for
## more details on the paths which are checked for the configuration file.
##
## This file is best viewed in a editor which supports python mode
## syntax highlighting. Blank lines, or lines starting with a comment
## symbol, are ignored, as are trailing comments. Other lines must
## have the format
## key : val ## optional comment
##
## Colors: for the color values below, you can either use - a
## matplotlib color string, such as r, k, or b - an rgb tuple, such as
## (1.0, 0.5, 0.0) - a hex string, such as ff00ff - a scalar
## grayscale intensity such as 0.75 - a legal html color name, e.g., red,
## blue, darkslategray
##### CONFIGURATION BEGINS HERE
## The default backend. If you omit this parameter, the first
## working backend from the following list is used:
## MacOSX Qt5Agg Qt4Agg Gtk3Agg TkAgg WxAgg Agg
##
## Other choices include:
## Qt5Cairo Qt4Cairo GTK3Cairo TkCairo WxCairo Cairo Wx PS PDF SVG Template.
##
## You can also deploy your own backend outside of matplotlib by
## referring to the module name (which must be in the PYTHONPATH) as
## 'module://my_backend'.
#backend : Agg
## Note that this can be overridden by the environment variable
## QT_API used by Enthought Tool Suite (ETS); valid values are
## "pyqt" and "pyside". The "pyqt" setting has the side effect of
## forcing the use of Version 2 API for QString and QVariant.
## The port to use for the web server in the WebAgg backend.
#webagg.port : 8988
## The address on which the WebAgg web server should be reachable
#webagg.address : 127.0.0.1
## If webagg.port is unavailable, a number of other random ports will
## be tried until one that is available is found.
#webagg.port_retries : 50
## When True, open the webbrowser to the plot that is shown
#webagg.open_in_browser : True
## if you are running pyplot inside a GUI and your backend choice
## conflicts, we will automatically try to find a compatible one for
## you if backend_fallback is True
#backend_fallback: True
#interactive : False
#toolbar : toolbar2 ## None | toolbar2 ("classic" is deprecated)
#timezone : UTC ## a pytz timezone string, e.g., US/Central or Europe/Paris
## Where your matplotlib data lives if you installed to a non-default
## location. This is where the matplotlib fonts, bitmaps, etc reside
#datapath : /home/jdhunter/mpldata
#### LINES
## See http://matplotlib.org/api/artist_api.html#module-matplotlib.lines for more
## information on line properties.
#lines.linewidth : 1.5 ## line width in points
#lines.linestyle : - ## solid line
#lines.color : C0 ## has no affect on plot(); see axes.prop_cycle
#lines.marker : None ## the default marker
#lines.markerfacecolor : auto ## the default markerfacecolor
#lines.markeredgecolor : auto ## the default markeredgecolor
#lines.markeredgewidth : 1.0 ## the line width around the marker symbol
#lines.markersize : 6 ## markersize, in points
#lines.dash_joinstyle : round ## miter|round|bevel
#lines.dash_capstyle : butt ## butt|round|projecting
#lines.solid_joinstyle : round ## miter|round|bevel
#lines.solid_capstyle : projecting ## butt|round|projecting
#lines.antialiased : True ## render lines in antialiased (no jaggies)
## The three standard dash patterns. These are scaled by the linewidth.
#lines.dashed_pattern : 3.7, 1.6
#lines.dashdot_pattern : 6.4, 1.6, 1, 1.6
#lines.dotted_pattern : 1, 1.65
#lines.scale_dashes : True
#markers.fillstyle: full ## full|left|right|bottom|top|none
#### PATCHES
## Patches are graphical objects that fill 2D space, like polygons or
## circles. See
## http://matplotlib.org/api/artist_api.html#module-matplotlib.patches
## information on patch properties
#patch.linewidth : 1 ## edge width in points.
#patch.facecolor : C0
#patch.edgecolor : black ## if forced, or patch is not filled
#patch.force_edgecolor : False ## True to always use edgecolor
#patch.antialiased : True ## render patches in antialiased (no jaggies)
#### HATCHES
#hatch.color : black
#hatch.linewidth : 1.0
#### Boxplot
#boxplot.notch : False
#boxplot.vertical : True
#boxplot.whiskers : 1.5
#boxplot.bootstrap : None
#boxplot.patchartist : False
#boxplot.showmeans : False
#boxplot.showcaps : True
#boxplot.showbox : True
#boxplot.showfliers : True
#boxplot.meanline : False
#boxplot.flierprops.color : black
#boxplot.flierprops.marker : o
#boxplot.flierprops.markerfacecolor : none
#boxplot.flierprops.markeredgecolor : black
#boxplot.flierprops.markeredgewidth : 1.0
#boxplot.flierprops.markersize : 6
#boxplot.flierprops.linestyle : none
#boxplot.flierprops.linewidth : 1.0
#boxplot.boxprops.color : black
#boxplot.boxprops.linewidth : 1.0
#boxplot.boxprops.linestyle : -
#boxplot.whiskerprops.color : black
#boxplot.whiskerprops.linewidth : 1.0
#boxplot.whiskerprops.linestyle : -
#boxplot.capprops.color : black
#boxplot.capprops.linewidth : 1.0
#boxplot.capprops.linestyle : -
#boxplot.medianprops.color : C1
#boxplot.medianprops.linewidth : 1.0
#boxplot.medianprops.linestyle : -
#boxplot.meanprops.color : C2
#boxplot.meanprops.marker : ^
#boxplot.meanprops.markerfacecolor : C2
#boxplot.meanprops.markeredgecolor : C2
#boxplot.meanprops.markersize : 6
#boxplot.meanprops.linestyle : --
#boxplot.meanprops.linewidth : 1.0
#### FONT
## font properties used by text.Text. See
## http://matplotlib.org/api/font_manager_api.html for more
## information on font properties. The 6 font properties used for font
## matching are given below with their default values.
##
## The font.family property has five values: 'serif' (e.g., Times),
## 'sans-serif' (e.g., Helvetica), 'cursive' (e.g., Zapf-Chancery),
## 'fantasy' (e.g., Western), and 'monospace' (e.g., Courier). Each of
## these font families has a default list of font names in decreasing
## order of priority associated with them. When text.usetex is False,
## font.family may also be one or more concrete font names.
##
## The font.style property has three values: normal (or roman), italic
## or oblique. The oblique style will be used for italic, if it is not
## present.
##
## The font.variant property has two values: normal or small-caps. For
## TrueType fonts, which are scalable fonts, small-caps is equivalent
## to using a font size of 'smaller', or about 83%% of the current font
## size.
##
## The font.weight property has effectively 13 values: normal, bold,
## bolder, lighter, 100, 200, 300, ..., 900. Normal is the same as
## 400, and bold is 700. bolder and lighter are relative values with
## respect to the current weight.
##
## The font.stretch property has 11 values: ultra-condensed,
## extra-condensed, condensed, semi-condensed, normal, semi-expanded,
## expanded, extra-expanded, ultra-expanded, wider, and narrower. This
## property is not currently implemented.
##
## The font.size property is the default font size for text, given in pts.
## 10 pt is the standard value.
#font.family : sans-serif
#font.style : normal
#font.variant : normal
#font.weight : normal
#font.stretch : normal
## note that font.size controls default text sizes. To configure
## special text sizes tick labels, axes, labels, title, etc, see the rc
## settings for axes and ticks. Special text sizes can be defined
## relative to font.size, using the following values: xx-small, x-small,
## small, medium, large, x-large, xx-large, larger, or smaller
#font.size : 10.0
#font.serif : DejaVu Serif, Bitstream Vera Serif, Computer Modern Roman, New Century Schoolbook, Century Schoolbook L, Utopia, ITC Bookman, Bookman, Nimbus Roman No9 L, Times New Roman, Times, Palatino, Charter, serif
#font.sans-serif : DejaVu Sans, Bitstream Vera Sans, Computer Modern Sans Serif, Lucida Grande, Verdana, Geneva, Lucid, Arial, Helvetica, Avant Garde, sans-serif
#font.cursive : Apple Chancery, Textile, Zapf Chancery, Sand, Script MT, Felipa, cursive
#font.fantasy : Comic Sans MS, Chicago, Charcoal, ImpactWestern, Humor Sans, xkcd, fantasy
#font.monospace : DejaVu Sans Mono, Bitstream Vera Sans Mono, Computer Modern Typewriter, Andale Mono, Nimbus Mono L, Courier New, Courier, Fixed, Terminal, monospace
#### TEXT
## text properties used by text.Text. See
## http://matplotlib.org/api/artist_api.html#module-matplotlib.text for more
## information on text properties
#text.color : black
#### LaTeX customizations. See http://wiki.scipy.org/Cookbook/Matplotlib/UsingTex
#text.usetex : False ## use latex for all text handling. The following fonts
## are supported through the usual rc parameter settings:
## new century schoolbook, bookman, times, palatino,
## zapf chancery, charter, serif, sans-serif, helvetica,
## avant garde, courier, monospace, computer modern roman,
## computer modern sans serif, computer modern typewriter
## If another font is desired which can loaded using the
## LaTeX \usepackage command, please inquire at the
## matplotlib mailing list
#text.latex.preamble : ## IMPROPER USE OF THIS FEATURE WILL LEAD TO LATEX FAILURES
## AND IS THEREFORE UNSUPPORTED. PLEASE DO NOT ASK FOR HELP
## IF THIS FEATURE DOES NOT DO WHAT YOU EXPECT IT TO.
## text.latex.preamble is a single line of LaTeX code that
## will be passed on to the LaTeX system. It may contain
## any code that is valid for the LaTeX "preamble", i.e.
## between the "\documentclass" and "\begin{document}"
## statements.
## Note that it has to be put on a single line, which may
## become quite long.
## The following packages are always loaded with usetex, so
## beware of package collisions: color, geometry, graphicx,
## type1cm, textcomp.
## Adobe Postscript (PSSNFS) font packages may also be
## loaded, depending on your font settings.
#text.latex.preview : False
#text.hinting : auto ## May be one of the following:
## none: Perform no hinting
## auto: Use FreeType's autohinter
## native: Use the hinting information in the
# font file, if available, and if your
# FreeType library supports it
## either: Use the native hinting information,
# or the autohinter if none is available.
## For backward compatibility, this value may also be
## True === 'auto' or False === 'none'.
#text.hinting_factor : 8 ## Specifies the amount of softness for hinting in the
## horizontal direction. A value of 1 will hint to full
## pixels. A value of 2 will hint to half pixels etc.
#text.antialiased : True ## If True (default), the text will be antialiased.
## This only affects the Agg backend.
## The following settings allow you to select the fonts in math mode.
## They map from a TeX font name to a fontconfig font pattern.
## These settings are only used if mathtext.fontset is 'custom'.
## Note that this "custom" mode is unsupported and may go away in the
## future.
#mathtext.cal : cursive
#mathtext.rm : sans
#mathtext.tt : monospace
#mathtext.it : sans:italic
#mathtext.bf : sans:bold
#mathtext.sf : sans
#mathtext.fontset : dejavusans ## Should be 'dejavusans' (default),
## 'dejavuserif', 'cm' (Computer Modern), 'stix',
## 'stixsans' or 'custom'
#mathtext.fallback_to_cm : True ## When True, use symbols from the Computer Modern
## fonts when a symbol can not be found in one of
## the custom math fonts.
#mathtext.default : it ## The default font to use for math.
## Can be any of the LaTeX font names, including
## the special name "regular" for the same font
## used in regular text.
#### AXES
## default face and edge color, default tick sizes,
## default fontsizes for ticklabels, and so on. See
## http://matplotlib.org/api/axes_api.html#module-matplotlib.axes
#axes.facecolor : white ## axes background color
#axes.edgecolor : black ## axes edge color
#axes.linewidth : 0.8 ## edge linewidth
#axes.grid : False ## display grid or not
#axes.grid.axis : both ## which axis the grid should apply to
#axes.grid.which : major ## gridlines at major, minor or both ticks
#axes.titlesize : large ## fontsize of the axes title
#axes.titleweight : normal ## font weight of title
#axes.titlepad : 6.0 ## pad between axes and title in points
#axes.labelsize : medium ## fontsize of the x any y labels
#axes.labelpad : 4.0 ## space between label and axis
#axes.labelweight : normal ## weight of the x and y labels
#axes.labelcolor : black
#axes.axisbelow : line ## draw axis gridlines and ticks below
## patches (True); above patches but below
## lines ('line'); or above all (False)
#axes.formatter.limits : -7, 7 ## use scientific notation if log10
## of the axis range is smaller than the
## first or larger than the second
#axes.formatter.use_locale : False ## When True, format tick labels
## according to the user's locale.
## For example, use ',' as a decimal
## separator in the fr_FR locale.
#axes.formatter.use_mathtext : False ## When True, use mathtext for scientific
## notation.
#axes.formatter.min_exponent: 0 ## minimum exponent to format in scientific notation
#axes.formatter.useoffset : True ## If True, the tick label formatter
## will default to labeling ticks relative
## to an offset when the data range is
## small compared to the minimum absolute
## value of the data.
#axes.formatter.offset_threshold : 4 ## When useoffset is True, the offset
## will be used when it can remove
## at least this number of significant
## digits from tick labels.
#axes.spines.left : True ## display axis spines
#axes.spines.bottom : True
#axes.spines.top : True
#axes.spines.right : True
#axes.unicode_minus : True ## use unicode for the minus symbol
## rather than hyphen. See
## http://en.wikipedia.org/wiki/Plus_and_minus_signs#Character_codes
#axes.prop_cycle : cycler('color', ['1f77b4', 'ff7f0e', '2ca02c', 'd62728', '9467bd', '8c564b', 'e377c2', '7f7f7f', 'bcbd22', '17becf'])
## color cycle for plot lines as list of string
## colorspecs: single letter, long name, or web-style hex
## Note the use of string escapes here ('1f77b4', instead of 1f77b4)
## as opposed to the rest of this file.
#axes.autolimit_mode : data ## How to scale axes limits to the data.
## Use "data" to use data limits, plus some margin
## Use "round_number" move to the nearest "round" number
#axes.xmargin : .05 ## x margin. See `axes.Axes.margins`
#axes.ymargin : .05 ## y margin See `axes.Axes.margins`
#polaraxes.grid : True ## display grid on polar axes
#axes3d.grid : True ## display grid on 3d axes
#### DATES
## These control the default format strings used in AutoDateFormatter.
## Any valid format datetime format string can be used (see the python
## `datetime` for details). For example using '%%x' will use the locale date representation
## '%%X' will use the locale time representation and '%%c' will use the full locale datetime
## representation.
## These values map to the scales:
## {'year': 365, 'month': 30, 'day': 1, 'hour': 1/24, 'minute': 1 / (24 * 60)}
#date.autoformatter.year : %Y
#date.autoformatter.month : %Y-%m
#date.autoformatter.day : %Y-%m-%d
#date.autoformatter.hour : %m-%d %H
#date.autoformatter.minute : %d %H:%M
#date.autoformatter.second : %H:%M:%S
#date.autoformatter.microsecond : %M:%S.%f
#### TICKS
## see http://matplotlib.org/api/axis_api.html#matplotlib.axis.Tick
#xtick.top : False ## draw ticks on the top side
#xtick.bottom : True ## draw ticks on the bottom side
#xtick.labeltop : False ## draw label on the top
#xtick.labelbottom : True ## draw label on the bottom
#xtick.major.size : 3.5 ## major tick size in points
#xtick.minor.size : 2 ## minor tick size in points
#xtick.major.width : 0.8 ## major tick width in points
#xtick.minor.width : 0.6 ## minor tick width in points
#xtick.major.pad : 3.5 ## distance to major tick label in points
#xtick.minor.pad : 3.4 ## distance to the minor tick label in points
#xtick.color : black ## color of the tick labels
#xtick.labelsize : medium ## fontsize of the tick labels
#xtick.direction : out ## direction: in, out, or inout
#xtick.minor.visible : False ## visibility of minor ticks on x-axis
#xtick.major.top : True ## draw x axis top major ticks
#xtick.major.bottom : True ## draw x axis bottom major ticks
#xtick.minor.top : True ## draw x axis top minor ticks
#xtick.minor.bottom : True ## draw x axis bottom minor ticks
#xtick.alignment : center ## alignment of xticks
#ytick.left : True ## draw ticks on the left side
#ytick.right : False ## draw ticks on the right side
#ytick.labelleft : True ## draw tick labels on the left side
#ytick.labelright : False ## draw tick labels on the right side
#ytick.major.size : 3.5 ## major tick size in points
#ytick.minor.size : 2 ## minor tick size in points
#ytick.major.width : 0.8 ## major tick width in points
#ytick.minor.width : 0.6 ## minor tick width in points
#ytick.major.pad : 3.5 ## distance to major tick label in points
#ytick.minor.pad : 3.4 ## distance to the minor tick label in points
#ytick.color : black ## color of the tick labels
#ytick.labelsize : medium ## fontsize of the tick labels
#ytick.direction : out ## direction: in, out, or inout
#ytick.minor.visible : False ## visibility of minor ticks on y-axis
#ytick.major.left : True ## draw y axis left major ticks
#ytick.major.right : True ## draw y axis right major ticks
#ytick.minor.left : True ## draw y axis left minor ticks
#ytick.minor.right : True ## draw y axis right minor ticks
#ytick.alignment : center_baseline ## alignment of yticks
#### GRIDS
#grid.color : b0b0b0 ## grid color
#grid.linestyle : - ## solid
#grid.linewidth : 0.8 ## in points
#grid.alpha : 1.0 ## transparency, between 0.0 and 1.0
#### Legend
#legend.loc : best
#legend.frameon : True ## if True, draw the legend on a background patch
#legend.framealpha : 0.8 ## legend patch transparency
#legend.facecolor : inherit ## inherit from axes.facecolor; or color spec
#legend.edgecolor : 0.8 ## background patch boundary color
#legend.fancybox : True ## if True, use a rounded box for the
## legend background, else a rectangle
#legend.shadow : False ## if True, give background a shadow effect
#legend.numpoints : 1 ## the number of marker points in the legend line
#legend.scatterpoints : 1 ## number of scatter points
#legend.markerscale : 1.0 ## the relative size of legend markers vs. original
#legend.fontsize : medium
#legend.title_fontsize : None ## None sets to the same as the default axes.
## Dimensions as fraction of fontsize:
#legend.borderpad : 0.4 ## border whitespace
#legend.labelspacing : 0.5 ## the vertical space between the legend entries
#legend.handlelength : 2.0 ## the length of the legend lines
#legend.handleheight : 0.7 ## the height of the legend handle
#legend.handletextpad : 0.8 ## the space between the legend line and legend text
#legend.borderaxespad : 0.5 ## the border between the axes and legend edge
#legend.columnspacing : 2.0 ## column separation
#### FIGURE
## See http://matplotlib.org/api/figure_api.html#matplotlib.figure.Figure
#figure.titlesize : large ## size of the figure title (Figure.suptitle())
#figure.titleweight : normal ## weight of the figure title
#figure.figsize : 6.4, 4.8 ## figure size in inches
#figure.dpi : 100 ## figure dots per inch
#figure.facecolor : white ## figure facecolor
#figure.edgecolor : white ## figure edgecolor
#figure.frameon : True ## enable figure frame
#figure.max_open_warning : 20 ## The maximum number of figures to open through
## the pyplot interface before emitting a warning.
## If less than one this feature is disabled.
## The figure subplot parameters. All dimensions are a fraction of the
#figure.subplot.left : 0.125 ## the left side of the subplots of the figure
#figure.subplot.right : 0.9 ## the right side of the subplots of the figure
#figure.subplot.bottom : 0.11 ## the bottom of the subplots of the figure
#figure.subplot.top : 0.88 ## the top of the subplots of the figure
#figure.subplot.wspace : 0.2 ## the amount of width reserved for space between subplots,
## expressed as a fraction of the average axis width
#figure.subplot.hspace : 0.2 ## the amount of height reserved for space between subplots,
## expressed as a fraction of the average axis height
## Figure layout
#figure.autolayout : False ## When True, automatically adjust subplot
## parameters to make the plot fit the figure
## using `tight_layout`
#figure.constrained_layout.use: False ## When True, automatically make plot
## elements fit on the figure. (Not compatible
## with `autolayout`, above).
#figure.constrained_layout.h_pad : 0.04167 ## Padding around axes objects. Float representing
#figure.constrained_layout.w_pad : 0.04167 ## inches. Default is 3./72. inches (3 pts)
#figure.constrained_layout.hspace : 0.02 ## Space between subplot groups. Float representing
#figure.constrained_layout.wspace : 0.02 ## a fraction of the subplot widths being separated.
#### IMAGES
#image.aspect : equal ## equal | auto | a number
#image.interpolation : nearest ## see help(imshow) for options
#image.cmap : viridis ## A colormap name, gray etc...
#image.lut : 256 ## the size of the colormap lookup table
#image.origin : upper ## lower | upper
#image.resample : True
#image.composite_image : True ## When True, all the images on a set of axes are
## combined into a single composite image before
## saving a figure as a vector graphics file,
## such as a PDF.
#### CONTOUR PLOTS
#contour.negative_linestyle : dashed ## string or on-off ink sequence
#contour.corner_mask : True ## True | False | legacy
#### ERRORBAR PLOTS
#errorbar.capsize : 0 ## length of end cap on error bars in pixels
#### HISTOGRAM PLOTS
#hist.bins : 10 ## The default number of histogram bins.
## If Numpy 1.11 or later is
## installed, may also be `auto`
#### SCATTER PLOTS
#scatter.marker : o ## The default marker type for scatter plots.
#scatter.edgecolors : face ## The default edgecolors for scatter plots.
#### Agg rendering
#### Warning: experimental, 2008/10/10
#agg.path.chunksize : 0 ## 0 to disable; values in the range
## 10000 to 100000 can improve speed slightly
## and prevent an Agg rendering failure
## when plotting very large data sets,
## especially if they are very gappy.
## It may cause minor artifacts, though.
## A value of 20000 is probably a good
## starting point.
#### PATHS
#path.simplify : True ## When True, simplify paths by removing "invisible"
## points to reduce file size and increase rendering
## speed
#path.simplify_threshold : 0.111111111111 ## The threshold of similarity below which
## vertices will be removed in the
## simplification process
#path.snap : True ## When True, rectilinear axis-aligned paths will be snapped to
## the nearest pixel when certain criteria are met. When False,
## paths will never be snapped.
#path.sketch : None ## May be none, or a 3-tuple of the form (scale, length,
## randomness).
## *scale* is the amplitude of the wiggle
## perpendicular to the line (in pixels). *length*
## is the length of the wiggle along the line (in
## pixels). *randomness* is the factor by which
## the length is randomly scaled.
#path.effects : [] ##
#### SAVING FIGURES
## the default savefig params can be different from the display params
## e.g., you may want a higher resolution, or to make the figure
## background white
#savefig.dpi : figure ## figure dots per inch or 'figure'
#savefig.facecolor : white ## figure facecolor when saving
#savefig.edgecolor : white ## figure edgecolor when saving
#savefig.format : png ## png, ps, pdf, svg
#savefig.bbox : standard ## 'tight' or 'standard'.
## 'tight' is incompatible with pipe-based animation
## backends but will workd with temporary file based ones:
## e.g. setting animation.writer to ffmpeg will not work,
## use ffmpeg_file instead
#savefig.pad_inches : 0.1 ## Padding to be used when bbox is set to 'tight'
#savefig.jpeg_quality: 95 ## when a jpeg is saved, the default quality parameter.
#savefig.directory : ~ ## default directory in savefig dialog box,
## leave empty to always use current working directory
#savefig.transparent : False ## setting that controls whether figures are saved with a
## transparent background by default
#savefig.orientation : portrait ## Orientation of saved figure
### tk backend params
#tk.window_focus : False ## Maintain shell focus for TkAgg
### ps backend params
#ps.papersize : letter ## auto, letter, legal, ledger, A0-A10, B0-B10
#ps.useafm : False ## use of afm fonts, results in small files
#ps.usedistiller : False ## can be: None, ghostscript or xpdf
## Experimental: may produce smaller files.
## xpdf intended for production of publication quality files,
## but requires ghostscript, xpdf and ps2eps
#ps.distiller.res : 6000 ## dpi
#ps.fonttype : 3 ## Output Type 3 (Type3) or Type 42 (TrueType)
### pdf backend params
#pdf.compression : 6 ## integer from 0 to 9
## 0 disables compression (good for debugging)
#pdf.fonttype : 3 ## Output Type 3 (Type3) or Type 42 (TrueType)
#pdf.use14corefonts : False
#pdf.inheritcolor : False
### svg backend params
#svg.image_inline : True ## write raster image data directly into the svg file
#svg.fonttype : path ## How to handle SVG fonts:
## none: Assume fonts are installed on the machine where the SVG will be viewed.
## path: Embed characters as paths -- supported by most SVG renderers
#svg.hashsalt : None ## if not None, use this string as hash salt
## instead of uuid4
### pgf parameter
#pgf.rcfonts : True
#pgf.preamble : ## see text.latex.preamble for documentation
#pgf.texsystem : xelatex
### docstring params
##docstring.hardcopy = False ## set this when you want to generate hardcopy docstring
## Event keys to interact with figures/plots via keyboard.
## Customize these settings according to your needs.
## Leave the field(s) empty if you don't need a key-map. (i.e., fullscreen : '')
#keymap.fullscreen : f, ctrl+f ## toggling
#keymap.home : h, r, home ## home or reset mnemonic
#keymap.back : left, c, backspace, MouseButton.BACK ## forward / backward keys
#keymap.forward : right, v, MouseButton.FORWARD ## for quick navigation
#keymap.pan : p ## pan mnemonic
#keymap.zoom : o ## zoom mnemonic
#keymap.save : s, ctrl+s ## saving current figure
#keymap.help : f1 ## display help about active tools
#keymap.quit : ctrl+w, cmd+w, q ## close the current figure
#keymap.quit_all : W, cmd+W, Q ## close all figures
#keymap.grid : g ## switching on/off major grids in current axes
#keymap.grid_minor : G ## switching on/off minor grids in current axes
#keymap.yscale : l ## toggle scaling of y-axes ('log'/'linear')
#keymap.xscale : k, L ## toggle scaling of x-axes ('log'/'linear')
#keymap.all_axes : a ## enable all axes
#keymap.copy : ctrl+c, cmd+c ## Copy figure to clipboard
###ANIMATION settings
#animation.html : none ## How to display the animation as HTML in
## the IPython notebook. 'html5' uses
## HTML5 video tag; 'jshtml' creates a
## Javascript animation
#animation.writer : ffmpeg ## MovieWriter 'backend' to use
#animation.codec : h264 ## Codec to use for writing movie
#animation.bitrate: -1 ## Controls size/quality tradeoff for movie.
## -1 implies let utility auto-determine
#animation.frame_format: png ## Controls frame format used by temp files
#animation.html_args: ## Additional arguments to pass to html writer
#animation.ffmpeg_path: ffmpeg ## Path to ffmpeg binary. Without full path
## $PATH is searched
#animation.ffmpeg_args: ## Additional arguments to pass to ffmpeg
#animation.avconv_path: avconv ## Path to avconv binary. Without full path
## $PATH is searched
#animation.avconv_args: ## Additional arguments to pass to avconv
#animation.convert_path: convert ## Path to ImageMagick's convert binary.
## On Windows use the full path since convert
## is also the name of a system tool.
#animation.convert_args: ## Additional arguments to pass to convert
#animation.embed_limit : 20.0 ## Limit, in MB, of size of base64 encoded
## animation in HTML (i.e. IPython notebook)